Free Gage R&R template
An Excel workbook for the standard AIAG study (3 operators × 10 parts × 3 trials) with live average-and-range formulas: fill the grid and get %GRR, EV / AV / PV, NDC, and an acceptable / marginal / unacceptable verdict. Includes a filled example and step-by-step instructions. No email gate, no signup.
You'll run this study again after a repair or recalibration. Axiospec keeps each study on the gage's record, next to its calibration history, and reminds you when the calibration is due. Free for up to 50 instruments.
What’s inside the workbook
Instructions
How to pick parts and operators, randomize trials, and enter readings, plus how to read %GRR and NDC once the study is done. The method and every d2* constant are stated on the sheet so nothing is a black box.
Blank study with live formulas
The classic AIAG data grid: three trial rows per operator across ten part columns, with per-part averages and ranges, R-double-bar, X-diff, Rp, all five sigmas, the four % study variation figures, %GRR against tolerance, NDC, and the verdict. Results appear only when all 90 cells are filled, so a half-entered study never shows a misleading number.
Filled example
A completed dimensional study (%GRR 21.7% of study variation, NDC 6, marginal verdict) so you can see exactly how a finished study reads before you run your own.
The workbook’s formulas are script-generated and verified cell-by-cell against the same Gage R&R engine behind the free online Gage R&R calculator, so the spreadsheet, the calculator, and the Axiospec in-app MSA studies all agree to the digit.
Run the same study in Axiospec
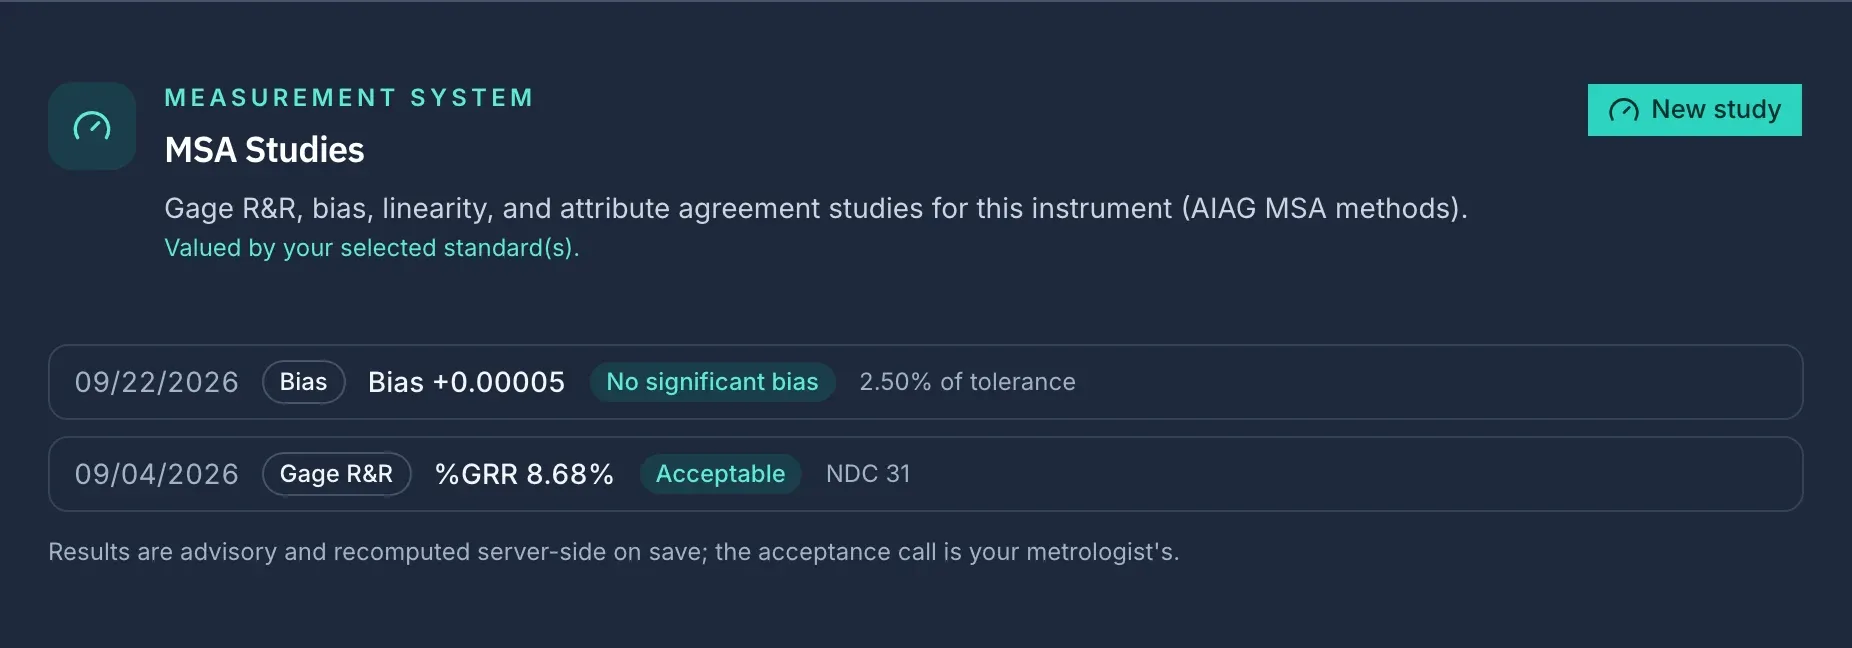
Axiospec runs the same AIAG average-and-range calculation and saves each study on the gage's record, next to its calibration history. Free for up to 50 instruments.
Run this study in Axiospec, free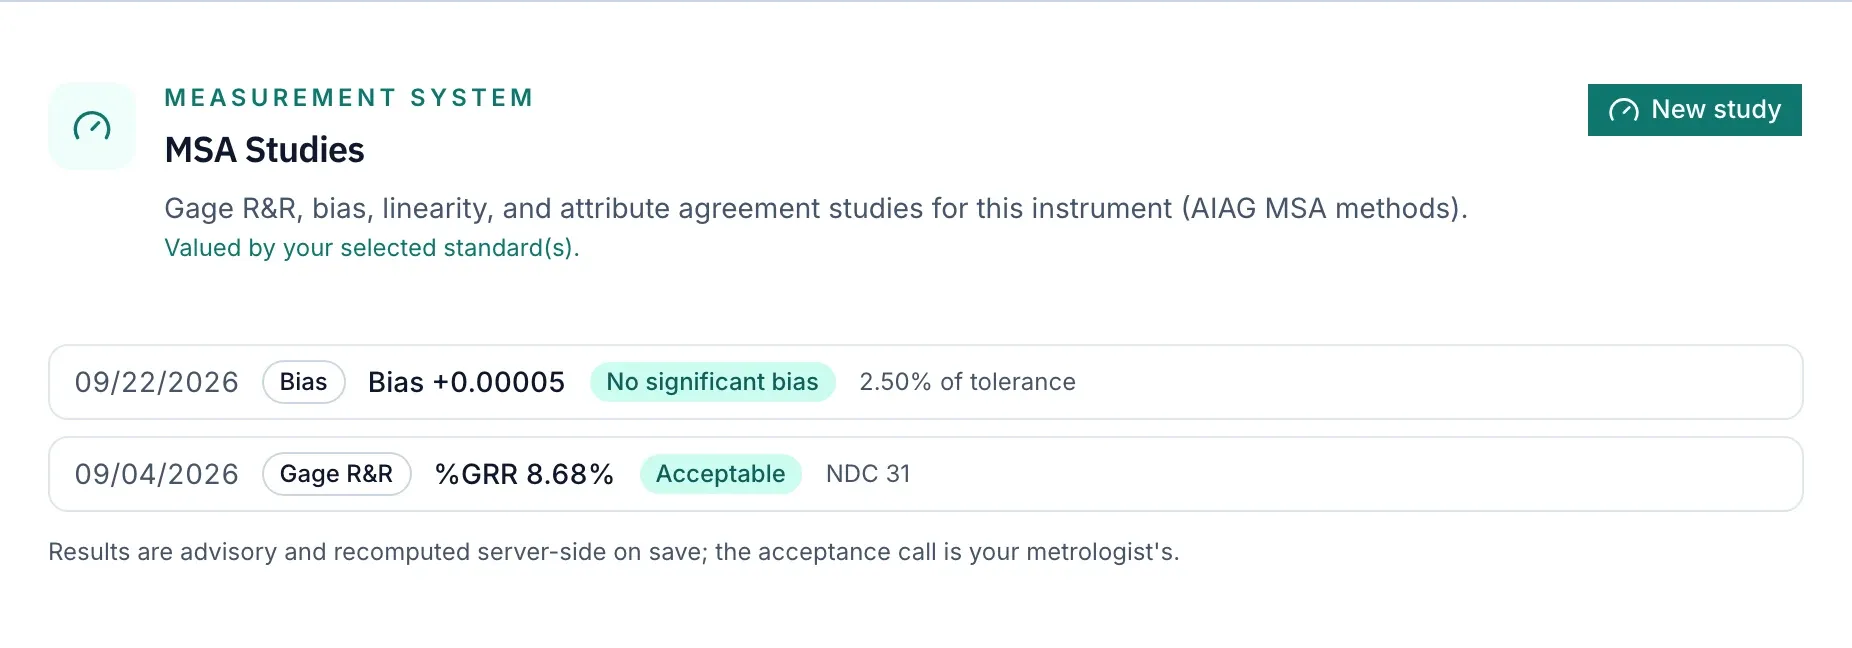
Need a different study size? Build a CSV data sheet
The Excel workbook is fixed at 3 × 10 × 3 because its d2* constants are specific to those counts. For any other size, generate a blank CSV data-collection sheet here, record the readings, then import it into the online calculator, which picks the right constants for whatever size you ran.
Format: one row per operator and part, one column per trial. The same format the online calculator imports. Set the calculator's operators, parts, and trials to match your sheet before importing.
How to run the study
- 1. Pick 10 parts that span production. Choose parts across the normal range of the process, not ten near-identical parts. A study run on identical parts overstates %GRR because there is little part variation to compare against.
- 2. Pick 3 operators who normally use the gage. The point is to measure the measurement system as it actually runs, not its best-case operator.
- 3. Blind the part numbers. Number the parts where operators cannot see them during measurement, and present parts in random order each trial.
- 4. Measure: every operator, every part, three trials. That is the 90 readings the grid expects.
- 5. Enter the readings in the yellow cells. The results block stays blank until all 90 cells are filled, then computes everything at once.
- 6. Enter the tolerance (optional). With a total tolerance width entered, the verdict is judged against %GRR of tolerance (can the system judge parts against the spec?); without one, against % study variation (can it resolve these parts?).
Reading the results
| %GRR | AIAG reading |
|---|---|
| < 10% | Generally acceptable. |
| 10% – 30% | Conditionally acceptable, depending on the application, the importance of the characteristic, and the cost of the gage and of repair. |
| > 30% | Unacceptable. Improve the gage, the fixturing, or the training. |
NDC (number of distinct categories, floor(1.41 × σ_part / σ_GRR)) should be 5 or more for a system used to control a process or sort parts. These are guidelines, not pass or fail lines drawn by a standard: a safety-critical measurement may demand tighter than 10%, and a rough screening check may live with more.
IATF 16949 clause 7.1.5.1.1 requires statistical studies, such as Gage R&R, for each measurement system named in the control plan.
When a spreadsheet is enough, and when it is not
For a single study, this workbook is genuinely all you need: the method is the AIAG manual’s own hand calculation, and the sheet shows every intermediate so an auditor can follow it. Where spreadsheets start to hurt is the program around the study: remembering which gages are due for an R&R, keeping the study attached to the instrument’s history, and showing an auditor the trail of who measured what and when. That program layer is what Axiospec does, with Gage R&R, bias and linearity studies captured against each instrument, and it is free for shops tracking under 50 instruments. The template stays fully useful on its own either way.
Still tracking calibration in a spreadsheet or Access?
Send us the file as it is and we load it for you. We map your columns and keep your instrument IDs and intervals. It usually takes a couple of business days, and it is free on every plan. After that, due dates come from the system rather than from memory, and more than one person can work in it at once.
Keep the study on the gage it belongs to, with the trail an auditor asks for.
Common questions
-
What is in the Gage R&R template?
Three sheets. Instructions: how to run the study and read the results. Gage R&R Study: a blank 3 operator x 10 part x 3 trial data grid with live formulas that compute R-double-bar, X-diff, Rp, the EV, AV, GRR, PV and TV sigmas, %EV, %AV, %GRR, %PV, %GRR against tolerance, NDC, and an acceptable / marginal / unacceptable verdict as soon as all 90 cells are filled. Example: the same sheet completed with a real dimensional study so you can see how a finished study reads.
-
Is it really free? Do I have to enter an email?
Yes and no. The download link is a plain file link: no email gate, no signup, no trial. It is published by Axiospec as part of a free set of metrology tools and templates.
-
Can I run a different study size, like 2 operators or 2 trials?
The Excel workbook is fixed at the standard AIAG study of 3 operators x 10 parts x 3 trials, because the d2* constants baked into its formulas are specific to those counts. For any other size, use the CSV data-collection sheet builder on this page to print or share a collection sheet, then paste or import the readings into the free online Gage R&R calculator, which picks the correct d2* constants for whatever size you ran.
-
Does the template use the average-and-range method or ANOVA?
The AIAG MSA 4th edition average-and-range (X-bar and R) method. It is the classic transparent hand-calculation method and matches the worked examples in the AIAG manual. Its honest limitation is that it cannot estimate the operator-by-part interaction; ANOVA can, and is preferred when you have software for it. For most studies the two methods agree on the verdict.
-
What are the acceptance criteria for a Gage R&R study?
The AIAG guideline: %GRR under 10% is generally acceptable; 10% to 30% is conditionally acceptable depending on the application, the importance of the characteristic, and the cost of the gage; over 30% is unacceptable and the measurement system needs work. The number of distinct categories (NDC) should be 5 or more for a system used to control a process or sort parts. These are guidelines rather than hard limits set by a standard.
-
How do I know the formulas are right?
The workbook is generated by a script, not typed by hand, and every result cell is verified against the same Gage R&R engine that powers the Axiospec online calculator and in-app MSA studies, which itself carries a golden-vector unit test against the AIAG average-and-range method. The d2* constants (EV from the trial count, AV and PV from the single-subgroup table) are printed on the sheet so you can check them against the AIAG or Duncan tables yourself.
This template applies the AIAG MSA average-and-range method to the readings you enter. It does not estimate the operator-by-part interaction (use ANOVA for that), does not replace the AIAG Measurement Systems Analysis manual, and is not your quality system. Validate any study against your documented MSA procedure before acting on it.
Keep the study with the gage
Axiospec captures Gage R&R, bias, and linearity studies against each instrument's tamper-evident history. Free under 50 instruments.
Got a gage list? Send it over and we load it for you, usually in a couple of business days. Free on every plan.